Here is the raw html code:
<!DOCTYPE HTML PUBLIC "-//W3C//DTD HTML 4.01//EN" "
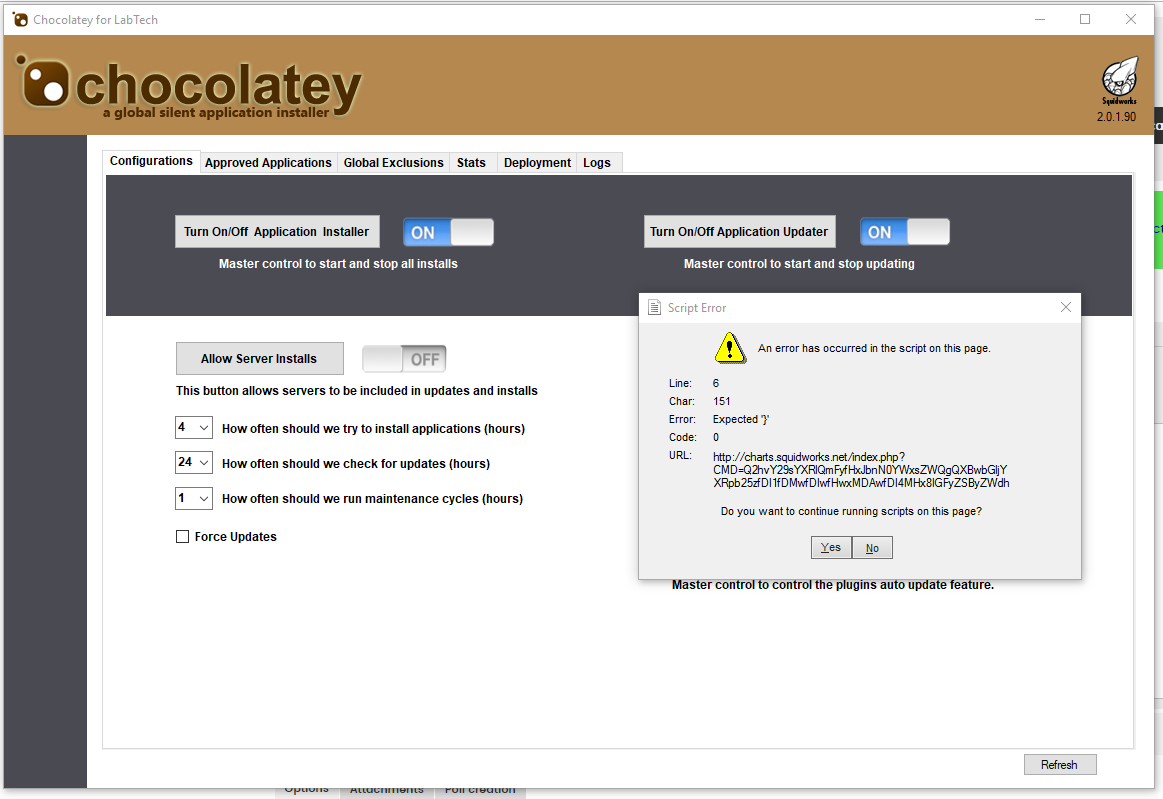
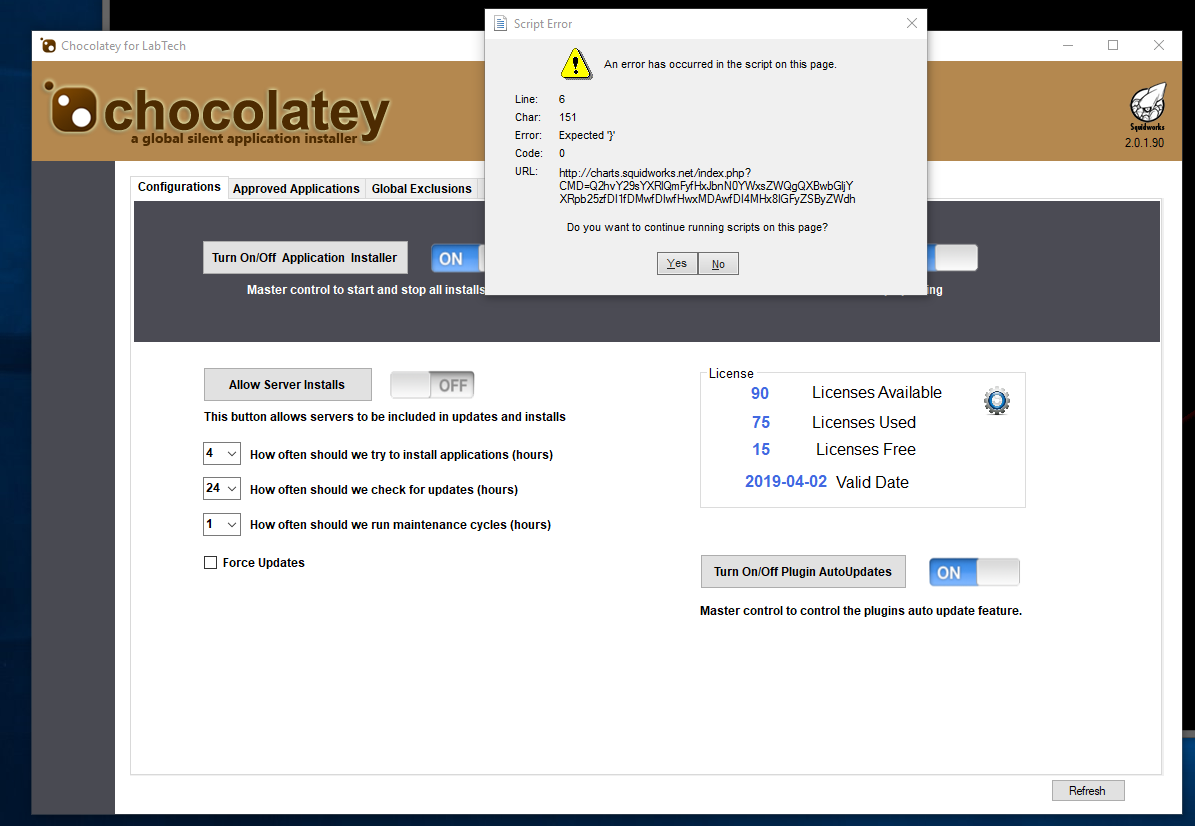
http://www.w3.org/TR/html4/strict.dtd"> ... head><meta http-equiv="Content-Type" content="text/html; charset=utf-8"><title>Squid Charts API</title><link rel="stylesheet" href="style.css" type="text/css"> <script src="./amcharts/amcharts.js" type="text/javascript"></script><script src="./amcharts/gauge.js" type="text/javascript"></script> <script type="text/javascript">
var chart;
var arrow;
var axis;
AmCharts.ready(function () {
// create angular gauge
chart = new AmCharts.AmAngularGauge();
chart.addTitle("Installs Today");
// create axis
axis = new AmCharts.GaugeAxis();
axis.startValue = 0;
axis.axisThickness = 1;
axis.valueInterval = 1;
axis.endValue = 10;
// color bands
var band1 = new AmCharts.GaugeBand();
band1.startValue = 0;
band1.endValue = 10;
band1.color = "#00CC00";
var band2 = new AmCharts.GaugeBand();
band2.startValue = 0;
band2.endValue = 0;
band2.color = "#00CC00";
var band3 = new AmCharts.GaugeBand();
band3.startValue = 0;
band3.endValue = 0;
band3.color = "#00CC00";
band3.innerRadius = "95%";
axis.bands = [band1, band2, band3];
// bottom text
axis.bottomTextYOffset = -20;
axis.setBottomText("Applications");
chart.addAxis(axis);
// gauge arrow
arrow = new AmCharts.GaugeArrow();
chart.addArrow(arrow);
chart.write("chartdiv");
// change value every 2 seconds
setInterval(randomValue, 2000);
});
// set random value
function randomValue() {
// var value = Math.round(Math.random() * 200);
arrow.setValue(0);
axis.setBottomText(0 + " Applications");
}
</script>
</head><body><div id="chartdiv" style="width: 100%; height:270px;"></div></body></html>